GrafanaCON 2026 in Barcelona Unveils Grafana 13, Revolutionary Loki Architecture, and AI-Powered Observability Tools

Barcelona, Spain – Grafana Labs, a leading provider of open and composable observability platforms, made a series of pivotal announcements at its annual GrafanaCON 2026 event in Barcelona, signaling a significant evolution in how organizations monitor and manage their digital infrastructure and emerging AI systems. Headlining the releases were Grafana 13, featuring dynamic dashboards and expanded integrations; a groundbreaking Kafka-backed architecture for Loki, Grafana’s open-source log aggregation system; and new AI Observability capabilities within Grafana Cloud designed for real-time evaluation of AI applications. Additionally, a novel command-line interface (CLI) named GCX was introduced, aimed at seamlessly integrating observability data directly into agentic development environments.
GrafanaCON 2026: A Nexus for Observability Innovation
GrafanaCON has consistently served as a crucial gathering for the global observability community, bringing together developers, engineers, and industry leaders to explore the latest advancements in monitoring, logging, and tracing. The 2026 edition, held against the vibrant backdrop of Barcelona, underscored Grafana Labs’ commitment to pushing the boundaries of what’s possible in a rapidly evolving technological landscape. The event highlighted a clear strategic direction: enhancing efficiency, reducing operational overhead, and integrating observability more deeply into the developer workflow, especially in the context of burgeoning AI technologies.
The key announcements at GrafanaCON 2026 are poised to reshape how engineering teams approach system reliability, performance optimization, and the critical task of understanding complex distributed systems. From fundamental architectural shifts in log management to developer-centric tooling and cutting-edge AI monitoring, Grafana Labs showcased a comprehensive vision for the future of observability.
Grafana 13: Core Platform Evolution and New Features
At the heart of the announcements was the release of Grafana 13, the latest iteration of the widely adopted open-source visualization and dashboarding platform. This release introduces several key enhancements aimed at improving user experience, workflow efficiency, and data integration capabilities. Among the most anticipated features, dynamic dashboards have moved to general availability, empowering users to create more flexible and responsive visualizations that can adapt to changing data inputs or user contexts without manual reconfigurations. This significantly reduces the overhead associated with maintaining numerous static dashboards for varied use cases or environments.
Further bolstering its enterprise readiness, Grafana 13 now includes robust Git-based workflow support. This integration allows development and operations teams to manage their Grafana dashboards and configurations as code, leveraging familiar version control systems like Git. This paradigm shift facilitates collaborative development, auditability, and automated deployment of observability assets, aligning Grafana more closely with modern DevOps and GitOps practices. Such capabilities are crucial for organizations seeking to scale their observability efforts while maintaining consistency and control across diverse teams and environments.
The platform also expanded its already extensive data source ecosystem, now boasting over 170 integrations. This continued expansion reinforces Grafana’s position as a truly composable observability platform, capable of ingesting and visualizing data from virtually any source, from cloud providers and databases to specialized IoT devices and custom applications. This breadth of integration ensures that organizations can consolidate their monitoring efforts within a single pane of glass, irrespective of their underlying technology stack.
Revolutionizing Log Management: Loki’s Kafka-Backed Architecture
Perhaps the most significant architectural overhaul announced at GrafanaCON 2026 concerns Loki, Grafana’s highly popular, horizontally scalable, multi-tenant log aggregation system. The traditional Loki architecture, while lauded for its simplicity and efficiency, faced inherent challenges in achieving optimal high availability and resource utilization due to its replication strategy.
The Challenge of Traditional Loki Replication
Historically, Loki achieved high availability through a replication factor of three, meaning every incoming log line was sent to three separate ingesters. While seemingly straightforward on paper, this method relied heavily on precise file naming and time synchronization across distributed ingesters for deduplication. Trevor Whitney, Staff Software Engineer at Grafana Labs, elaborated on the practical limitations during a briefing at GrafanaCON. He noted that in a distributed system, ingesters inevitably drift in their time syncing. This minute drift prevents files from being perfectly deduped by filename, leading to significant storage inefficiencies. Whitney revealed that internal metrics indicated an average storage multiplier of 2.3x – for every log line ingested, it was effectively stored 2.3 times.
This 2.3x multiplier was not merely an abstract figure; it had tangible, detrimental impacts across the entire observability pipeline. It translated directly into increased costs for CPU at ingestion, higher memory pressure on ingesters, elevated network costs due to redundant data transfer, and substantially larger object storage bills. Furthermore, this duplication carried a performance penalty at query time, as the system had to reconcile and deduplicate these redundant entries on the fly, adding latency and computational overhead. For large-scale deployments handling petabytes of log data, these inefficiencies amounted to substantial operational expenses and performance bottlenecks.
The Kafka Solution: Enhanced Durability and Efficiency
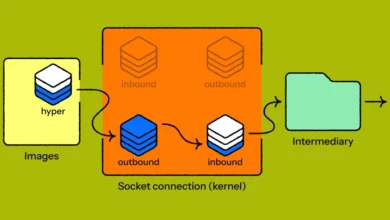
The new Loki architecture directly addresses these challenges by introducing Apache Kafka as a durable intermediary layer for log ingestion. This fundamental shift replaces the replication-at-ingestion strategy. Under the new paradigm, logs land in Kafka only once, establishing a single, durable source of truth. Ingesters then consume logs from this Kafka queue, eliminating the need for internal replication and effectively reducing the replication factor to one at the storage layer.
This change is transformative. By leveraging Kafka’s inherent durability and distributed messaging capabilities, Loki can achieve high availability and fault tolerance more efficiently. Logs are guaranteed to be stored durably in Kafka before being processed by ingesters, ensuring no data loss even if an ingester fails. This decoupling of ingestion from storage also allows for more flexible scaling of ingester components.
Combined with a redesigned query engine that intelligently distributes work across partitions and executes queries in parallel, the new architecture promises dramatic performance improvements. Grafana Labs claims this new setup can lead to up to 20 times less data scanned during queries and a remarkable 10 times faster performance on aggregated queries. These gains directly translate into lower operational costs, quicker incident response times, and a more efficient use of resources, making Loki an even more compelling solution for high-volume log management.
Performance Gains and Operational Trade-offs
The reported performance improvements are substantial. For instance, reducing scanned data by 20x can drastically cut down on object storage retrieval costs, which are often a significant component of cloud bills for large-scale observability. A 10x speed increase for aggregated queries means that engineers can get answers to complex diagnostic questions much faster, significantly shortening the mean time to resolution (MTTR) for incidents. This improvement is particularly critical in fast-paced production environments where every minute of downtime can result in considerable financial losses or reputational damage.
However, this architectural shift is not without its trade-offs. Loki’s original design principle emphasized minimal dependencies, primarily relying on object storage and nothing else. The introduction of Kafka breaks this long-standing tenet. Trevor Whitney openly acknowledged this strategic pivot: "Up until now, our only dependency has been object storage, and that’s kind of been a goal of the project from the beginning. So yes, this does introduce a second dependency. You will now have object storage and Kafka for any distributed installation of Loki."
Strategic Implications for Loki Deployments
This new dependency means that organizations running Loki at scale will need to factor Kafka into their operational surface. This includes deploying, managing, and monitoring Kafka clusters, which introduces additional complexity and operational overhead. For some, this might be a familiar territory, as Kafka is a widely adopted component in many modern data architectures. For others, it represents a new infrastructure component to master.
It is crucial to note that single-binary deployments of Loki, typically used in local setups, home labs, or smaller environments without the need for replication, will remain unaffected. These deployments can continue to run efficiently with just a local file system or object storage, as they do not orchestrate replication in the first place. The new architecture primarily targets large, distributed, and high-volume Loki installations where the benefits of Kafka-backed durability and efficiency far outweigh the added operational complexity. This strategic move positions Loki to handle even greater scales and stricter reliability requirements, solidifying its role as a robust log aggregation solution for demanding enterprise environments.

AI Observability: Monitoring the Next Generation of Applications
In a testament to the rapidly accelerating integration of Artificial Intelligence into enterprise applications, Grafana Labs launched an AI Observability product in public preview for teams monitoring Large Language Model (LLM)-powered applications in production. This new offering directly addresses the unique and complex challenges associated with observing, evaluating, and ensuring the reliability of AI systems.
Addressing the Unique Needs of AI Systems
Traditional observability tools, while effective for conventional software, often fall short when it comes to the nuances of AI and machine learning models. LLMs, in particular, introduce new dimensions of monitoring, including prompt engineering efficacy, token usage, latency of inference, model drift, hallucination rates, and overall response quality. Understanding the behavior and performance of these models in real-time is paramount for maintaining service quality, managing costs, and ensuring ethical AI deployment.
Grafana’s AI Observability solution provides dedicated capabilities to capture, visualize, and analyze these specific AI-centric metrics and logs. It aims to offer insights into the entire lifecycle of an AI application, from input prompts and model invocations to output responses and user feedback. This allows teams to identify issues such as performance degradation, unexpected model behavior, or cost overruns related to API usage, swiftly and effectively.
Real-time Evaluation and Performance Insights
The ability to monitor and evaluate AI systems in real time is a critical differentiator. As LLMs become more integrated into customer-facing applications, any degradation in their performance or accuracy can have immediate business impacts. Grafana’s solution enables engineers and data scientists to set up alerts for anomalies, track key performance indicators (KPIs) specific to AI, and visualize the health of their AI pipelines through customizable dashboards. This empowers teams to proactively identify and mitigate risks, ensuring that AI-powered features deliver consistent value and meet predefined service level objectives (SLOs).
The launch of this public preview signifies Grafana Labs’ strategic move into the burgeoning market of AI infrastructure and operations. It underscores the company’s understanding that as AI adoption matures, robust observability for these systems will become as fundamental as it is for traditional applications. By providing purpose-built tools, Grafana aims to become an indispensable partner for organizations building and operating the next generation of intelligent applications.
GCX: Bringing Observability Directly to Agentic Developers
Recognizing the evolving landscape of software development, particularly with the rise of AI-powered coding assistants, Grafana Labs unveiled GCX, a new agent-aware CLI (Command Line Interface) for integrating observability directly into AI-driven workflows. Launched in public preview, GCX is designed to bridge the gap between development environments and production observability data, dramatically improving developer productivity and reducing context switching.
The Developer Workflow Problem: Context Switching
The premise behind GCX is rooted in a common pain point for modern engineers. Many developers now spend a significant portion of their day within AI-assisted coding environments such as Claude Code, Cursor, or GitHub Copilot. When a production issue arises, the traditional workflow often necessitates a disruptive context switch: developers must navigate away from their code editor to a browser-based Grafana dashboard, manually sift through metrics and logs to diagnose the problem, then return to their editor to implement a fix, and finally switch back to Grafana to verify that the fix worked. This iterative, multi-tool process is inefficient and breaks the developer’s flow state.
GCX is engineered to collapse this loop. By surfacing Grafana Cloud data directly inside these agentic development environments, it enables developers to access critical observability insights without ever leaving their coding interface. This integration is particularly powerful when combined with the intelligence of AI coding agents, allowing for a more seamless and automated debugging and remediation process.
GCX in Action: A Seamless Debugging Cycle
Ward Bekker, who spearheaded the GCX development, highlighted the renewed relevance of CLI tools in the age of AI coding assistants during a live demo. "CLIs were never out of fashion, but they’re definitely more in fashion now, especially because of the agentic coding tools. A lot of folks notice that if you’re using CLIs on the command line in combination with Cursor or Claude Code, it’s extremely effective."
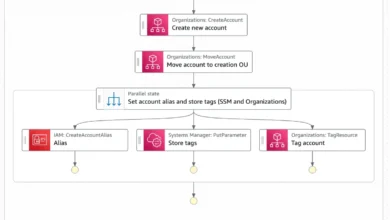
Bekker demonstrated a representative scenario illustrating GCX’s power. Imagine a synthetic monitoring check detects failures on an e-commerce order flow. Traditionally, this would trigger a manual investigation. With GCX, the workflow transforms:
- Automated Root Cause Analysis: Grafana Assistant, an intelligent feature within Grafana Cloud, runs an automated root cause analysis based on the synthetic monitoring alert.
- Contextual Data Retrieval: GCX then pulls that analysis, along with relevant source files, directly into Claude Code (or a similar AI-powered IDE).
- AI-Assisted Fix: Claude Code, leveraging its understanding of the code and the provided observability insights, proposes and applies a fix for the identified issue.
- Instant Verification: Crucially, GCX can then query the synthetic monitoring metrics directly from within the development environment to confirm immediate recovery.
This entire cycle, from detection to verification, can be completed without ever opening a browser tab or manually navigating through dashboards. It represents a significant leap forward in "shift-left" observability, embedding monitoring and diagnostic capabilities directly into the developer’s daily toolkit.
Strategic Approach: CLI and Beyond
Grafana Labs is not solely betting on a single integration model for this new developer experience. While GCX is being shipped as a CLI tool, the team is also developing a remote MCP (Monitoring, Control, and Provisioning) server in parallel. This dual approach reflects an understanding that different audiences and use cases may benefit from distinct integration patterns. The CLI offers immediate, interactive power to individual developers, while a server-based approach might facilitate broader, more automated integrations within larger CI/CD pipelines or specialized tooling. This strategic flexibility ensures that Grafana Labs can cater to a diverse range of developer preferences and operational requirements.
Broader Impact and Market Positioning
The announcements at GrafanaCON 2026 collectively paint a picture of Grafana Labs positioning itself not just as a visualization powerhouse, but as a comprehensive observability platform deeply integrated into the modern software development lifecycle. The architectural improvements to Loki underscore a commitment to foundational reliability and cost efficiency, addressing critical concerns for large-scale users. The introduction of AI Observability demonstrates foresight into emerging technological trends and the proactive development of tools for the next generation of applications. Finally, GCX highlights a keen focus on developer experience, recognizing that empowering engineers with seamless access to observability data directly within their workflows is key to accelerating innovation and improving operational efficiency.
These strategic moves are set to have a significant impact on the broader observability market. By enhancing its core offerings, expanding into AI-specific monitoring, and refining the developer experience, Grafana Labs is strengthening its competitive stance against both open-source alternatives and commercial observability platforms. The emphasis on open standards and composability, combined with these advanced features, continues to make Grafana a compelling choice for organizations seeking flexible, powerful, and cost-effective observability solutions.
Availability and Future Outlook
Grafana 13 and the substantial Loki updates, including the new Kafka-backed architecture, are available immediately. GCX, the agent-aware CLI, is currently in public preview, allowing developers to experiment with its capabilities and provide feedback. Similarly, the AI Observability solution is also in public preview within Grafana Cloud, inviting early adopters to begin monitoring their LLM-powered applications.
These releases collectively represent a significant step forward for Grafana Labs and the observability community. They demonstrate a clear vision for the future, one where observability is not just about reactive monitoring but about proactive efficiency, intelligent insights, and seamless integration into every stage of the software development and operational lifecycle, especially as AI continues to reshape the technological landscape.

