Celestial Alignment of the Crescent Moon Venus and the Pleiades Star Cluster Offers Rare Spring Spectacle
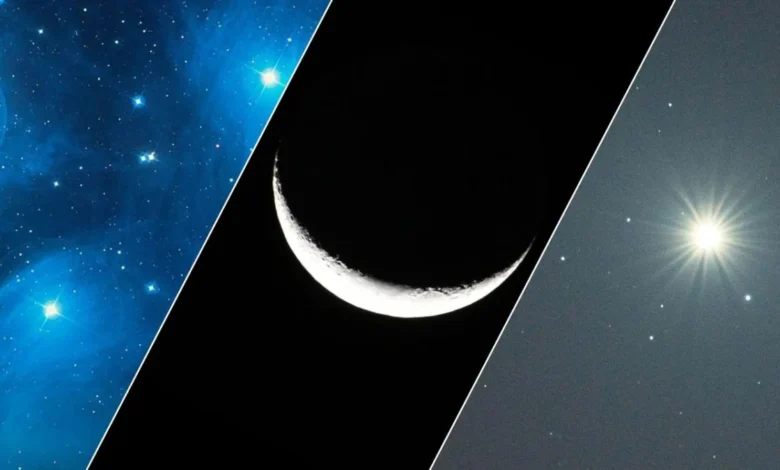
Stargazers and amateur astronomers across the Northern Hemisphere are preparing for a significant celestial event on the evening of April 19, as the waxing crescent moon, the planet Venus, and the Pleiades star cluster converge in the western sky. This transient alignment, occurring shortly after sunset, provides a unique opportunity for observers to witness three of the most distinct objects in the night sky in close proximity. The event is expected to be most visible between 30 and 90 minutes after the sun dips below the horizon, offering a narrow but rewarding window for photography and scientific observation.
The Geometry of the Evening Sky
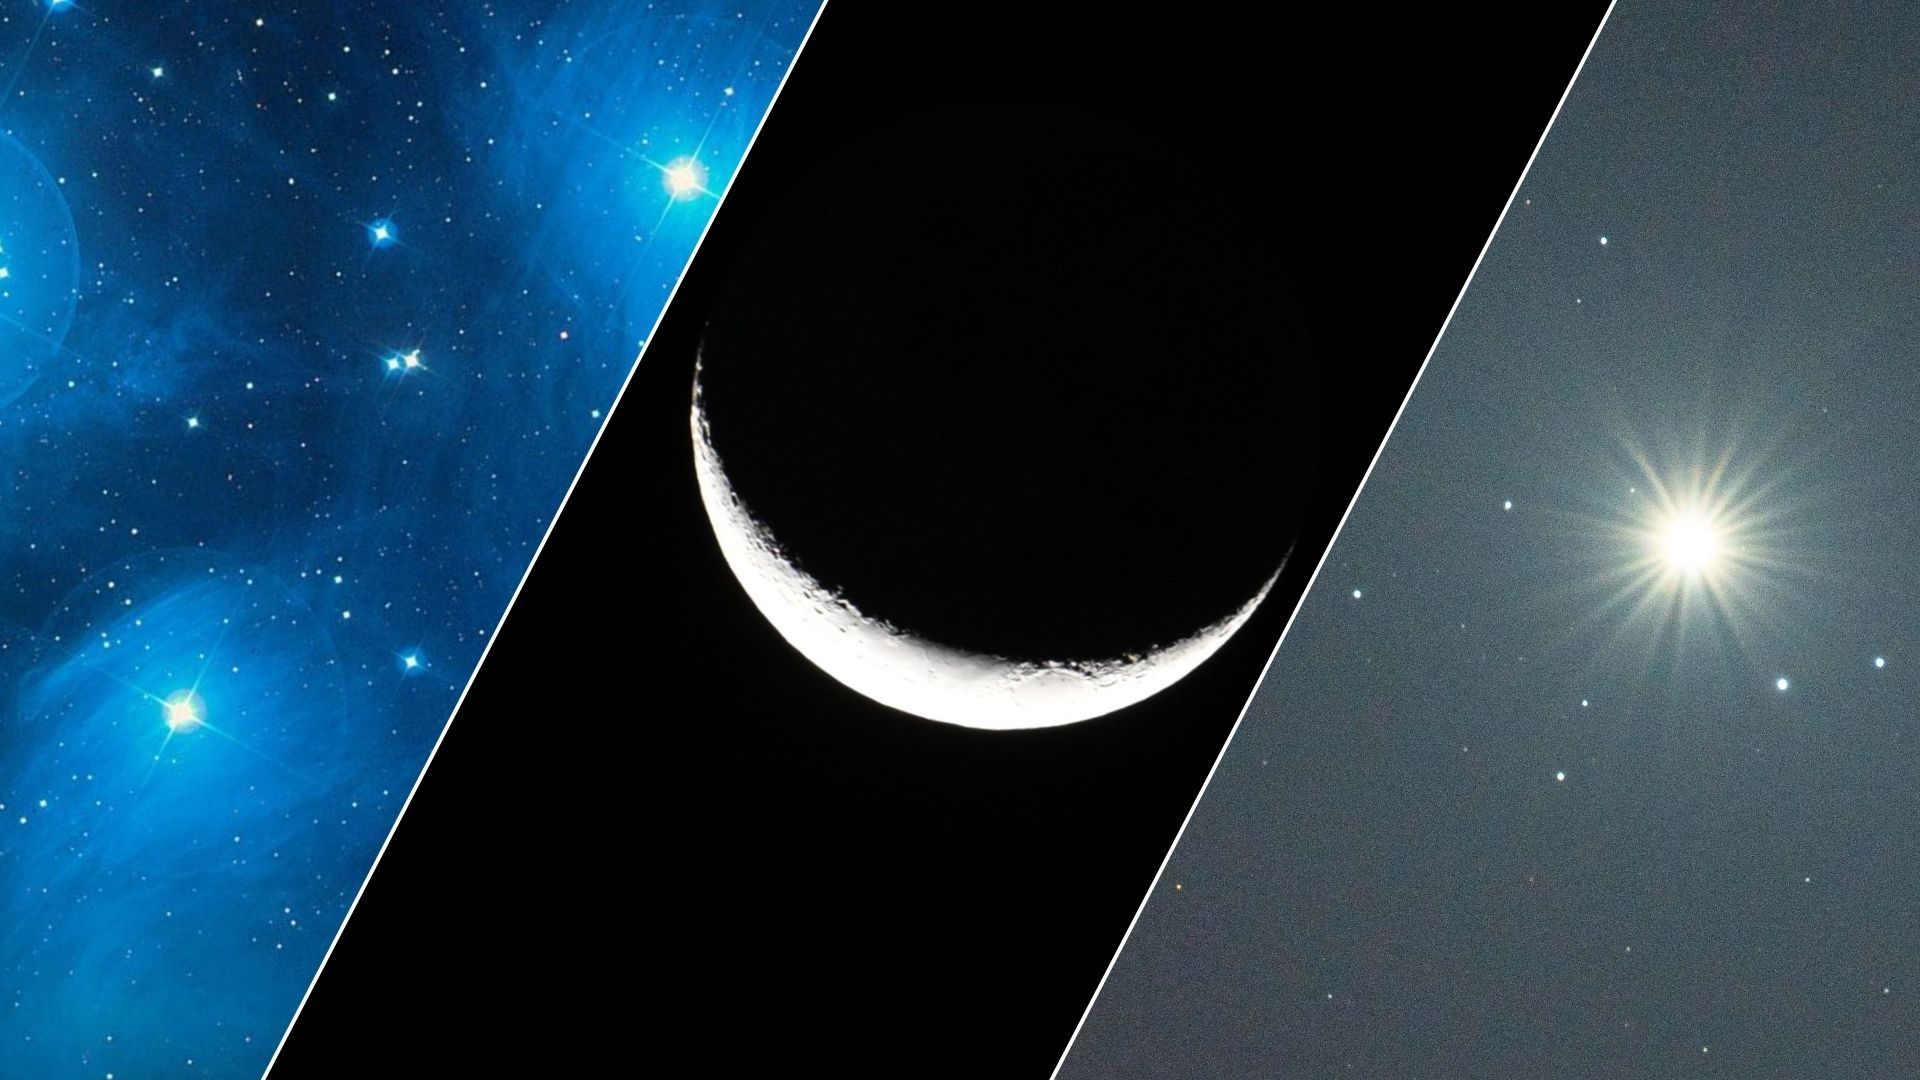
The primary attraction of the April 19 sky is the positioning of an 11%-lit waxing crescent moon. Appearing as a delicate, upturned sliver, the moon will be situated approximately 20 degrees above the western horizon. In astronomical terms, 20 degrees is roughly equivalent to the width of two clenched fists held at arm’s length against the sky. This elevation is high enough to clear most distant obstructions like trees or low-rise buildings, yet low enough to remain framed within the atmospheric glow of twilight.
Just two days prior, on April 17, the moon reached its "new" phase, making this its first significant appearance in the evening sky for the current lunar cycle. Because of its relative youth in the cycle, the crescent will be exceptionally thin, emphasizing the lunar topography along the terminator line—the dividing line between the light and dark sides of the moon.
Positioned below the lunar crescent will be Venus, the second planet from the sun and currently the brightest "star" in the evening sky. Known as the "Evening Star" during this portion of its orbit, Venus is currently trailing the sun, setting approximately two hours after sunset. Its brilliance is a result of its proximity to Earth and its highly reflective atmosphere, comprised largely of sulfuric acid clouds that boast a high albedo.
The Da Vinci Glow: A Study in Earthshine
One of the most aesthetically striking features of the April 19 alignment is the likely visibility of "earthshine," also scientifically referred to as the "Da Vinci Glow." This phenomenon occurs when sunlight reflects off the Earth’s surface—specifically its oceans and cloud cover—and hits the darkened portion of the moon. This reflected light provides a ghostly, secondary illumination to the part of the lunar disk not directly lit by the sun.
The term "Da Vinci Glow" honors the polymath Leonardo da Vinci, who, in the early 16th century, correctly hypothesized that the moon does not possess its own light but reflects light from other sources. He was the first to propose that the "ghostly" glow on the dark side of the moon was caused by sunlight reflecting off Earth’s vast oceans. Modern satellite data has confirmed this, showing that Earth is particularly bright when viewed from space due to its high cloud reflectivity, which acts as a giant mirror for the moon.
For observers on April 19, earthshine will give the moon a three-dimensional appearance, often described as "the old moon in the new moon’s arms." This effect is best viewed through binoculars or a small telescope, which can reveal subtle details on the shadowed lunar surface that are otherwise invisible to the naked eye.
The Pleiades: The Seven Sisters in the Background
Adding to the visual depth of the evening is the Pleiades open star cluster, also known as Messier 45 (M45). Located in the constellation Taurus, the Pleiades is one of the nearest star clusters to Earth and is easily visible to the naked eye under moderately dark skies. On April 19, the cluster will sit in the same general region as the moon and Venus, creating a triangular or linear arrangement depending on the observer’s exact time and location.
The Pleiades consists of middle-aged, hot blue stars that formed within the last 100 million years. While most people can distinguish six or seven stars with the naked eye—earning the cluster the nickname "The Seven Sisters"—the group actually contains over 1,000 confirmed stars. On this particular evening, the proximity of the bright moon and Venus may create some light interference, making the use of binoculars highly recommended to see the full extent of the cluster’s shimmering blue hue.
The Elusive Ice Giant: Uranus Joins the Fray
While the moon, Venus, and the Pleiades will dominate the visual landscape, a fourth, much more challenging object will be present. Uranus, the seventh planet from the sun, will be lurking approximately 5 degrees to the upper right of Venus.
Uranus presents a significant challenge for even experienced observers. With an apparent magnitude of approximately +5.8, it sits at the very edge of human naked-eye visibility under perfect, pitch-black conditions. Given its proximity to the horizon on April 19 and the lingering twilight glow, Uranus will be virtually impossible to see without optical aid.
However, for those equipped with a telescope or high-powered binoculars, Uranus will appear as a tiny, pale greenish-blue disk. Its distinct color is a result of methane in its cold atmosphere, which absorbs red light and reflects the blue and green portions of the spectrum. Its inclusion in this alignment adds a layer of depth for serious amateur astronomers looking to "hop" from the bright Venus to the faint ice giant.
Observational Techniques and Hand Measurements
To assist the public in locating these objects, astronomers often suggest using the "hand method" for measuring angular distances in the sky. When held at arm’s length:
- A single pinky finger covers about 1 degree of the sky.
- The three middle fingers cover about 5 degrees (the distance between Venus and Uranus on this night).
- A clenched fist covers about 10 degrees.
- An open hand (from thumb to pinky) covers about 25 degrees.
Using these measurements, observers can easily find the moon 20 degrees up and then look for Venus roughly 10 to 15 degrees below it. The Pleiades will be nestled nearby, completing the celestial portrait.
The Role of Atmospheric Conditions
The success of viewing this event is heavily dependent on local atmospheric conditions. Because the alignment occurs low on the western horizon, clarity is paramount. Atmospheric extinction—the dimming of light as it passes through the thickest part of the Earth’s atmosphere near the horizon—will affect the brightness of the objects.

"Seeing" conditions, a term used by astronomers to describe the stability of the air, will also play a role. If the atmosphere is turbulent, Venus may appear to "twinkle" or shimmer violently, and the delicate crescent of the moon may appear distorted. Observers are encouraged to find a location away from significant light pollution and, if possible, at a higher elevation to minimize the amount of atmosphere they must look through.
Scientific and Cultural Significance
Alignments such as the one on April 19 are technically known as "appulses" or "conjunctions," depending on the exact angular separation. While they do not have a direct physical effect on Earth, they serve as vital educational tools. These events provide a "clockwork" demonstration of the solar system’s mechanics, showing how the moon’s rapid orbit around Earth and the planets’ slower orbits around the sun create ever-changing perspectives.
Historically, the Pleiades and Venus have held immense cultural significance. From the ancient Greeks, who saw the Pleiades as the daughters of Atlas, to the Maya, who tracked the movements of Venus with incredible mathematical precision, these celestial bodies have guided human navigation, agriculture, and mythology for millennia. Seeing them paired with a young moon continues a long tradition of human sky-watching.
Preparation for Photography
Astrophotographers are expected to be out in force for this event. Capturing the "Da Vinci Glow" alongside the brilliance of Venus and the delicate stars of the Pleiades requires specific settings. Experts recommend using a tripod to avoid camera shake during the longer exposures needed to capture earthshine. A focal length between 50mm and 200mm is often ideal for framing all three objects together while maintaining enough detail to see the lunar crescent.
The contrast between the 11%-lit crescent and the much dimmer earthshine can be difficult to balance. Photographers often use "bracketing"—taking multiple shots at different exposure levels—to ensure they capture both the bright sliver and the faint glow of the rest of the lunar disk.
Looking Ahead: The Changing Sky
This specific configuration is a one-night-only event. Because the moon moves approximately 12 to 13 degrees across the sky every 24 hours, it will have moved significantly higher and further away from Venus and the Pleiades by the evening of April 20. Venus, too, is on the move, though much more slowly, as it continues its trek through the zodiacal constellations.
The April 19 alignment serves as a reminder of the dynamic nature of our immediate cosmic neighborhood. For those who miss this window, the next several months will continue to offer various planetary pairings, but few will feature the specific combination of a razor-thin crescent, the brightest planet, and the most famous star cluster in the sky.
As the sun sets on April 19, the western horizon will transform into a natural gallery. Whether viewed through a high-end telescope or simply with the naked eye from a backyard, the meeting of the moon, Venus, and the Pleiades is a testament to the quiet, predictable beauty of the universe. It encourages a moment of reflection on our place within the solar system and the enduring mystery of the stars that lie far beyond.


