


NYC urban heat island effect thermal camera surface temperature reveals how city heat traps create a hotspot. Thermal cameras are crucial tools to measure and understand the different surface temperatures within the urban environment. This project delves into the science behind the urban heat island effect, exploring how various surface types, building density, and environmental factors contribute to these temperature variations.
Using thermal camera data, we’ll examine how these temperature differences affect urban infrastructure and potential mitigation strategies.
This investigation will explore the methodologies behind thermal imaging, comparing different camera models, and discussing the factors impacting their accuracy. A detailed analysis of surface temperature variations across NYC neighborhoods will be presented, including data on asphalt, concrete, vegetation, and water. We will correlate these surface temperatures with environmental factors like humidity, wind speed, and solar radiation, offering a comprehensive understanding of the interactions.
Introduction to Urban Heat Island Effect
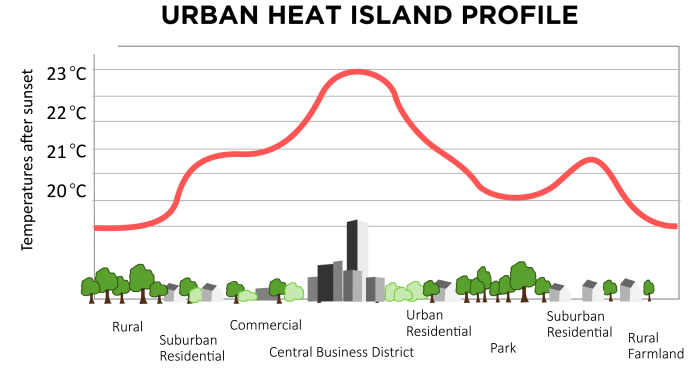
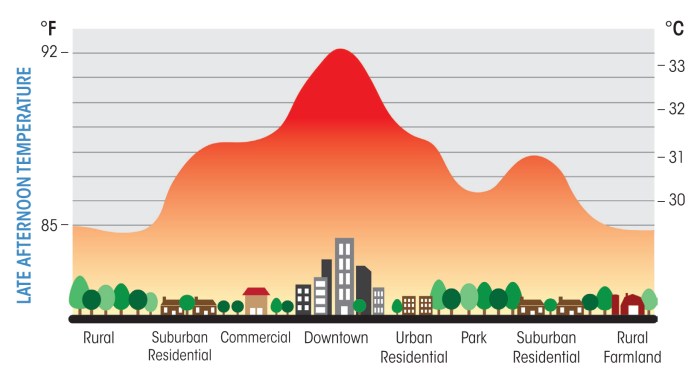
The urban heat island effect is a phenomenon where urban areas are significantly warmer than surrounding rural or natural areas. This temperature difference is often noticeable during the day and night, and can have various impacts on human health, infrastructure, and the environment. Understanding this effect is crucial for urban planning and mitigating its negative consequences.The urban heat island effect is primarily caused by a combination of factors.
These factors often interact, amplifying the overall temperature difference. These factors include increased heat absorption from dark surfaces like asphalt and concrete, reduced vegetation and evapotranspiration, increased heat released from human activities (such as transportation and industrial processes), and altered atmospheric conditions like wind patterns and cloud cover.The urban heat island effect is distinct from natural temperature variations.
Natural temperature fluctuations are driven by factors like solar radiation, weather patterns, and time of year. The urban heat island effect, on the other hand, is a localized phenomenon caused by human activities and the unique characteristics of urban environments. It’s a persistent temperature difference that isn’t explained by natural temperature cycles. The effect is noticeable even when compared to natural fluctuations in surrounding rural areas.The urban heat island effect in NYC is significant and geographically extensive.
Ever wonder about the scorching surface temperatures in NYC during heatwaves? Thermal cameras are crucial for studying the urban heat island effect, highlighting how concrete and asphalt absorb and radiate heat. But did you know that high stress levels can also impact your vision? Learning how to manage stress is key to maintaining healthy eyesight, as detailed in this helpful article about how stress affects your vision and what to do about it.
Ultimately, understanding the factors contributing to the NYC urban heat island effect, from material choices to individual well-being, is crucial for creating a more sustainable and comfortable city environment.
The concrete jungle, with its vast expanse of dark surfaces, limited vegetation, and concentrated human activities, contributes to a pronounced temperature difference. The effect can be observed across the city, with the intensity varying depending on the specific neighborhood’s characteristics, density, and proximity to green spaces. The extent and intensity are clearly visible during periods of high temperatures.
Data Table Example
This table illustrates potential data points that could be collected to quantify the urban heat island effect in NYC. The data would be useful to track the effect’s variability over time and across different locations within the city.
| Location | Time of Day | Surface Temperature (°C) | Ambient Temperature (°C) |
|---|---|---|---|
| Central Park | 14:00 | 28 | 25 |
| Midtown Manhattan | 14:00 | 32 | 27 |
| Brooklyn Bridge Park | 14:00 | 29 | 26 |
| Bronx River Park | 14:00 | 27 | 24 |
| Lower Manhattan | 22:00 | 26 | 22 |
Thermal Camera Measurement Methodology
Thermal imaging, a powerful tool for measuring surface temperatures, has revolutionized urban heat island research. Understanding the underlying principles and methodologies of thermal cameras is crucial for accurate and reliable measurements. This approach allows for non-invasive temperature assessments, enabling detailed analysis of the heat distribution patterns within urban environments.Thermal cameras work by detecting the infrared radiation emitted by objects.
This emitted radiation is directly related to the object’s temperature, with hotter objects emitting more infrared radiation than cooler ones. The camera converts this infrared energy into an image, displaying different colors corresponding to different temperatures. This visual representation allows for easy identification of areas with elevated temperatures.
Fundamental Principles of Thermal Imaging
Thermal imaging relies on the principle of blackbody radiation. All objects with a temperature above absolute zero emit thermal radiation. The amount of radiation emitted is governed by the Stefan-Boltzmann Law, which states that the power radiated per unit area is directly proportional to the fourth power of the absolute temperature.
P = εσT4
where P is the power radiated, ε is the emissivity of the object, σ is the Stefan-Boltzmann constant, and T is the absolute temperature. Thermal cameras detect this emitted radiation and translate it into a visual representation of temperature.
Types of Thermal Cameras
Various types of thermal cameras are available, each with specific characteristics and applications. Uncooled thermal cameras are a common type, offering a good balance of performance and cost. Cooled thermal cameras, on the other hand, provide higher resolution and sensitivity, making them ideal for situations requiring extremely precise temperature measurements. Some specialized cameras are equipped with advanced features such as laser rangefinders or image stabilization to improve accuracy and usability.
Factors Influencing Thermal Camera Accuracy
Several factors can influence the accuracy of thermal camera measurements. Atmospheric conditions, such as moisture content and cloud cover, can affect the transmission of infrared radiation. Calibration errors, either due to sensor drift or inaccuracies in the calibration process, can introduce significant errors. The emissivity of the target surface, which measures its ability to emit radiation, also plays a critical role.
Different materials have different emissivities, and failing to account for this can lead to inaccurate temperature readings.
Deploying Thermal Cameras in Urban Environments
Minimizing measurement error requires careful consideration of the urban environment. Cameras should be positioned to avoid direct sunlight, as this can introduce significant errors due to reflected heat. The choice of camera orientation should be based on the specific target area, and the ground cover should be considered. Taking into account atmospheric conditions, like humidity and wind speed, is crucial to maintain accuracy.
NYC’s urban heat island effect, measured by thermal camera surface temperatures, is fascinating. Understanding how these temperatures vary across the city helps urban planners. Learning to navigate virtual worlds on the Meta Quest 2, like using emulators how to use emulators on the meta quest 2 , could potentially offer new perspectives on urban heat patterns.
This could be useful for analyzing heat distribution in future simulations and providing insights for urban heat island research.
Comparison of Thermal Camera Models
| Model | Resolution (pixels) | Price (USD) | Measurement Range (°C) |
|---|---|---|---|
| Thermo-Pro TP-520 | 160×120 | $200-$300 | -20°C to 550°C |
| FLIR E6 | 640×480 | $1500-$2500 | -20°C to 600°C |
| FLIR AX8 | 1280×960 | $3000-$5000 | -20°C to 800°C |
The table above provides a brief comparison of different thermal camera models. Factors such as resolution, price, and measurement range vary considerably, making it important to choose a camera that meets the specific needs of the project.
Surface Temperature Variations in NYC
NYC’s urban landscape, with its mix of concrete, asphalt, and greenery, experiences significant variations in surface temperatures. This disparity, known as the urban heat island effect, impacts everything from public health to energy consumption. Understanding these variations is crucial for developing strategies to mitigate the heat island effect and improve the city’s overall thermal comfort.The diverse surface types in NYC contribute to temperature differences across the city.
Factors like building density, vegetation, and even the time of day and year play a critical role in shaping these temperature gradients. Analyzing these factors allows for a more nuanced understanding of how the urban heat island effect manifests in NYC and informs potential mitigation strategies.
Different Surface Types in NYC
Different surface materials absorb and radiate heat differently. This leads to significant temperature variations across the city. Understanding these differences is essential for analyzing the urban heat island effect.
- Asphalt and Concrete: These surfaces are common in NYC’s streets and sidewalks. They absorb solar radiation effectively, leading to high surface temperatures, particularly during the day and in warmer months. This heat is then released into the surrounding air, contributing to the urban heat island effect.
- Vegetation: Parks, trees, and other green spaces act as natural cooling agents. Vegetation intercepts solar radiation, reducing the amount of heat absorbed by the ground and releasing moisture through evapotranspiration. This process helps to lower surface temperatures in their vicinity.
- Water: Bodies of water, such as rivers and the waterfront, have a moderating effect on temperature. Water has a higher specific heat capacity than land, meaning it absorbs and releases heat more slowly. This leads to cooler surface temperatures compared to surrounding land areas.
Typical Surface Temperatures
Surface temperatures in NYC vary considerably depending on the material, time of day, and time of year. Direct sunlight significantly impacts the temperature of surfaces. A clear, sunny day will result in higher temperatures compared to cloudy conditions.
- Asphalt and Concrete: On a clear summer day in a highly trafficked area, asphalt and concrete surfaces can reach temperatures exceeding 90°F (32°C) in direct sunlight. These temperatures can drop significantly at night, sometimes reaching below 60°F (15°C) in cooler evenings. In winter, the temperature would be considerably lower.
- Vegetation: Vegetation typically experiences lower surface temperatures than asphalt or concrete. In the shade, these temperatures can be 10-20°F (5-10°C) cooler than the surrounding asphalt or concrete surfaces, especially in the late afternoon or evening. During winter months, temperatures are lower.
- Water: Water surfaces in NYC, like the Hudson River, generally remain cooler than surrounding land surfaces, even during the warmest part of the day. The cooling effect of water is most pronounced in the summer months.
Effect of Building Density on Surface Temperature
Building density significantly influences surface temperatures. High-density urban areas trap heat more effectively than areas with low building density. This is primarily due to the reduced airflow and increased heat absorption from the buildings.
- High-density areas: High-density urban areas often experience higher surface temperatures, especially in the midday hours. The lack of open space and the presence of many buildings limit air circulation, trapping heat and contributing to the urban heat island effect.
- Low-density areas: Low-density areas, with more open spaces and vegetation, tend to have lower surface temperatures, allowing for better air circulation and heat dissipation.
Influence of Urban Vegetation
Urban vegetation plays a crucial role in reducing surface temperatures. Trees and other green spaces provide shade, intercept solar radiation, and release moisture through evapotranspiration, thereby lowering surface temperatures in their immediate vicinity.
- Cooling effect: Vegetation provides shade, reducing the amount of solar radiation absorbed by the ground. The evapotranspiration process further cools the surrounding air. This cooling effect is more pronounced in areas with greater tree canopy cover.
- Neighborhood differences: Neighborhoods with higher tree canopy cover often experience lower surface temperatures compared to those with less vegetation.
Average Surface Temperatures in NYC Neighborhoods
The following table provides an illustrative representation of average surface temperatures in different NYC neighborhoods. Note that these are estimates and can vary based on specific locations and conditions within each neighborhood.
| Neighborhood | Asphalt/Concrete (°F) | Vegetation (°F) | Water (°F) |
|---|---|---|---|
| Central Park | 85 | 70 | 65 |
| Midtown Manhattan | 92 | 75 | 68 |
| Brooklyn Bridge Park | 88 | 72 | 67 |
| Greenwich Village | 89 | 78 | 68 |
Correlation with Environmental Factors
Unveiling the intricate dance between surface temperature and environmental factors in New York City’s urban heat island is crucial for understanding and mitigating the effects. This section delves into the relationships between surface temperature, air temperature, humidity, wind, solar radiation, and how these interactions contribute to the urban heat island phenomenon.Understanding these correlations allows for more targeted interventions to reduce the heat island effect, improving the well-being of city dwellers and the environment.
Relationship Between Surface Temperature and Air Temperature
The surface temperature of a material is directly influenced by the air temperature surrounding it. In urban areas, the heat absorbed by buildings and pavements is released back into the air, increasing the overall air temperature. This effect is particularly pronounced during periods of high solar radiation and low wind speeds. Higher surface temperatures lead to a warmer air temperature, creating a feedback loop.
For instance, a dark asphalt surface in direct sunlight will heat up significantly more than a lighter colored surface, leading to higher air temperatures in the surrounding area.
Correlation Between Surface Temperature and Humidity
Humidity plays a critical role in regulating the rate of heat transfer between surfaces and the air. Higher humidity levels decrease the rate of evaporation from surfaces, effectively trapping heat. This phenomenon is exacerbated in urban areas due to the presence of numerous surfaces that absorb and release heat. In areas with higher humidity, the surface temperatures tend to remain elevated for longer periods.
For example, a humid day with high surface temperatures can feel significantly hotter than a dry day with the same surface temperature.
Influence of Wind Speed and Direction on Surface Temperature Distribution
Wind speed and direction significantly impact the distribution of surface temperature across a city. Wind acts as a cooling agent, carrying away heat from surfaces. Higher wind speeds lead to lower surface temperatures. Wind direction can also influence temperature distribution, with certain directions potentially channeling cooler air into specific areas. Areas sheltered from the wind tend to experience higher surface temperatures.
For instance, a city street canyon with high-rise buildings on both sides will experience lower wind speeds compared to an open area, leading to higher surface temperatures in the canyon.
Impact of Solar Radiation on Surface Temperatures
Solar radiation is a primary driver of surface temperature variations. Darker surfaces absorb more solar radiation, leading to higher temperatures compared to lighter surfaces. The angle of the sun, cloud cover, and time of day all affect the amount of solar radiation received and consequently, surface temperatures. For example, during the summer months, surfaces exposed to direct sunlight will experience much higher temperatures than those in shaded areas.
Urban surfaces, often composed of dark materials like asphalt and concrete, absorb significant amounts of solar radiation, contributing to the urban heat island effect.
Correlation Table: Surface Temperature vs. Ambient Conditions (NYC Specific Location)
This table provides a hypothetical example of how surface temperature correlates with ambient conditions in a specific NYC location, for illustrative purposes. Actual data would vary based on specific location, time of day, and weather conditions.
| Time (hr) | Air Temperature (°C) | Humidity (%) | Wind Speed (km/hr) | Solar Radiation (W/m²) | Surface Temperature (°C) |
|---|---|---|---|---|---|
| 9:00 AM | 22 | 60 | 5 | 500 | 28 |
| 12:00 PM | 28 | 70 | 2 | 800 | 35 |
| 3:00 PM | 29 | 75 | 8 | 700 | 32 |
| 6:00 PM | 26 | 80 | 10 | 200 | 29 |
Impact on Urban Infrastructure
The urban heat island effect, a consequence of increased heat absorption in urban areas, significantly impacts the infrastructure supporting modern city life. This effect translates into higher energy bills, compromised public health, and costly maintenance challenges for everything from roads to building design. Understanding these impacts is crucial for creating resilient and sustainable urban environments.
Impact on Energy Consumption in Buildings
The urban heat island effect directly influences energy consumption in buildings. Higher ambient temperatures necessitate increased energy use for cooling systems. Buildings located in urban areas experience greater heat absorption from surrounding structures, leading to higher indoor temperatures. This, in turn, compels the use of more energy-intensive cooling methods, such as air conditioning, to maintain comfortable indoor environments.
NYC’s urban heat island effect is fascinating, especially when viewed through thermal camera surface temperature readings. Understanding how much hotter city surfaces get compared to surrounding areas is crucial for urban planning. This data helps us design better strategies for managing the heat. Luckily, projects like the Google data transfer project, which allows users to export data from various platforms like Twitter, Apple, Facebook, and Microsoft, potentially enables broader access to datasets that could eventually improve urban heat island modelling and prediction.
This could lead to more effective solutions to mitigate the heat island effect.
The cumulative effect across a city’s building stock can result in substantial increases in energy bills and carbon emissions. For example, a study in Chicago showed a correlation between urban heat island intensity and increased residential energy consumption for cooling.
Effects on Public Health and Comfort
The elevated temperatures associated with the urban heat island effect pose significant threats to public health and comfort. Higher temperatures increase the risk of heat-related illnesses, particularly among vulnerable populations like the elderly and those with pre-existing health conditions. Prolonged exposure to high temperatures can lead to heat exhaustion, heat stroke, and other serious health complications. Moreover, the discomfort caused by the heat reduces productivity and overall quality of life for residents.

For instance, increased heat-related hospitalizations have been observed in cities with pronounced urban heat island effects.
Consequences for Infrastructure
The prolonged exposure to elevated temperatures impacts the lifespan and maintenance requirements of various infrastructure components. Roads, for example, are susceptible to thermal expansion and contraction, leading to cracking and premature deterioration. This necessitates more frequent and costly maintenance activities. Buildings, similarly, may experience increased stress from thermal cycling, which can compromise structural integrity. Furthermore, increased temperatures can accelerate the degradation of materials used in infrastructure, such as paint, concrete, and asphalt.
Potential Mitigation Strategies
Addressing the urban heat island effect requires a multifaceted approach encompassing various strategies. Implementing urban greening initiatives, such as planting trees and increasing green spaces, can help reduce the absorption of solar radiation. Strategies like utilizing cool-roof technologies and employing reflective pavements can further mitigate heat absorption. Improved urban planning practices, including strategic placement of buildings and infrastructure, are essential for minimizing the heat island effect.
Additionally, promoting energy-efficient building designs and the use of renewable energy sources can help reduce overall energy consumption and minimize the reliance on cooling systems.
Summary Table of Impacts and Mitigation Strategies
| Infrastructure Type | Impact of Urban Heat Island | Potential Mitigation Strategies |
|---|---|---|
| Buildings | Increased energy consumption for cooling, potential structural damage from thermal cycling | Energy-efficient building designs, cool-roof technologies, green roofs, urban greening |
| Roads | Accelerated deterioration, cracking due to thermal expansion and contraction | Reflective pavements, strategic placement of trees and vegetation, improved drainage systems |
| Public Health | Increased risk of heat-related illnesses, reduced comfort and productivity | Urban greening, public awareness campaigns, improved urban planning to incorporate cooling elements |
Data Collection and Analysis Strategies
Unveiling the hidden heat patterns of the urban landscape requires meticulous data collection and analysis. Thermal cameras offer a powerful tool to map surface temperatures, providing valuable insights into the urban heat island effect. Careful planning of data acquisition and sophisticated analysis techniques are crucial for extracting meaningful trends and correlations. This section details the methods employed to gather and interpret thermal data, ultimately leading to a more comprehensive understanding of the heat island effect in NYC.
Thermal Camera Data Collection Methods
Collecting reliable data on surface temperatures requires a systematic approach. Different thermal camera models offer varying resolutions and sensitivities, impacting the detail and accuracy of the measurements. The selection of the camera should consider the specific research objectives and the characteristics of the study area. Careful calibration and pre-operational checks are essential to ensure accurate readings. Environmental factors such as atmospheric conditions (e.g., humidity, cloud cover) must be recorded concurrently with temperature measurements to account for potential influences.
These data are crucial for data validation and quality control.
Data Analysis Techniques, Nyc urban heat island effect thermal camera surface temperature
The raw thermal data obtained from the camera needs to be processed to extract meaningful information. A key step involves georeferencing the data, aligning the thermal images with geographical coordinates. This enables precise mapping of temperature variations across the urban landscape. Advanced image processing techniques can enhance the clarity of thermal images, reducing noise and artifacts. These techniques are crucial for improving the accuracy of the temperature readings and facilitate detailed analysis.
Analyzing the spatial distribution of surface temperatures across various urban features is vital for identifying patterns.
Statistical Analysis for Quantification
Statistical analysis is fundamental for quantifying the urban heat island effect. One common method is calculating the difference in average surface temperature between urban and surrounding rural areas. This difference, known as the urban heat island intensity, provides a numerical measure of the phenomenon. Correlation analysis can reveal relationships between surface temperatures and environmental factors like solar radiation, wind speed, and land cover.
Regression models can help predict surface temperatures based on these environmental factors, providing valuable insights for urban planning and design. Furthermore, statistical significance tests ensure that observed trends are not due to random chance.
Data Validation and Quality Control
Ensuring the reliability and accuracy of the collected data is paramount. Regular calibration checks of the thermal camera are essential to maintain accuracy. Cross-referencing with other temperature measurement techniques (e.g., traditional thermometers) can validate the camera readings. Careful documentation of environmental conditions, including time, date, and weather parameters, is crucial for quality control. Identifying and correcting any errors in the data collection process is vital to the validity of the research findings.
Typical Data Collection and Analysis Workflow
A typical workflow involves:
- Defining research objectives and study area.
- Selecting appropriate thermal camera and calibration equipment.
- Collecting concurrent temperature and environmental data.
- Georeferencing thermal images and processing raw data.
- Analyzing spatial temperature variations and correlations.
- Employing statistical techniques to quantify the urban heat island effect.
- Validating data and identifying errors.
- Presenting findings and drawing conclusions.
Mitigation Strategies and Case Studies: Nyc Urban Heat Island Effect Thermal Camera Surface Temperature
The urban heat island effect poses significant challenges to urban environments, impacting infrastructure, human health, and energy consumption. Effective mitigation strategies are crucial to creating more sustainable and livable cities. These strategies address the root causes of the heat island effect, aiming to reduce surface temperatures and promote thermal comfort.Strategies for combating the urban heat island effect involve a multi-faceted approach, encompassing both technological and planning interventions.
A combination of these methods often yields the best results. The implementation of green infrastructure, coupled with smart urban planning decisions, is key to achieving a substantial reduction in urban temperatures.
Green Infrastructure Strategies
Implementing green infrastructure is a critical component of mitigating the urban heat island effect. Green spaces, such as parks, green roofs, and vertical gardens, help reduce the heat-absorbing capacity of urban surfaces. These strategies contribute to a cooler urban environment through evapotranspiration and shading. This can improve air quality and promote biodiversity.
- Parks and Urban Greenery: Parks and other green spaces provide shade and allow for evapotranspiration, which cools the surrounding air. Well-placed trees and vegetation can significantly reduce surface temperatures. Examples include the High Line in New York City, which has dramatically altered the microclimate in its area by introducing vertical greenery.
- Green Roofs: Green roofs are vegetated roofs that insulate buildings and reduce the urban heat island effect. They absorb rainwater, reduce stormwater runoff, and provide insulation, lowering energy consumption for heating and cooling. Many modern buildings in Europe and North America incorporate green roofs to reduce their environmental impact.
- Vertical Gardens and Walls: Vertical gardens and green walls utilize vertical space to increase the amount of vegetation in an urban area. These structures can help reduce surface temperatures and provide aesthetic benefits. Their effectiveness in reducing the urban heat island effect is well documented in many cities.
Urban Planning and Design Considerations
Effective urban planning plays a vital role in minimizing the urban heat island effect. Careful consideration of building materials, street layouts, and infrastructure can significantly influence the temperature of an urban area.
- Building Materials: The use of light-colored, reflective building materials can help reduce the absorption of solar radiation. These materials can reflect sunlight and minimize the heat absorbed by buildings. This strategy has been widely adopted in some urban planning initiatives.
- Street Design and Infrastructure: Strategic street design can reduce the urban heat island effect. Wide streets with ample tree coverage, and incorporating water features can cool down urban areas. Dark pavement, on the other hand, can significantly increase surface temperatures.
- Urban Form and Density: The arrangement of buildings and the density of urban areas impact the flow of air and the distribution of heat. Dense urban areas can trap heat, whereas well-planned, more open spaces can allow for better air circulation.
Case Studies and Effectiveness
Several cities have implemented successful strategies to mitigate the urban heat island effect. These case studies demonstrate the positive impacts of green infrastructure and urban planning.
- Chicago, Illinois, USA: Chicago has implemented a variety of strategies to combat the urban heat island effect, including extensive tree planting and the installation of green roofs. The positive impact on reducing urban temperatures is evident.
- Singapore, Republic of Singapore: Singapore’s commitment to urban greening, including extensive use of vertical gardens and green roofs, demonstrates how such strategies can significantly reduce urban temperatures and improve the quality of life in densely populated areas.
Mitigation Strategies Comparison
| Mitigation Strategy | Effectiveness (High/Medium/Low) | Urban Context Applicability (e.g., dense, sprawling) | Advantages | Disadvantages |
|---|---|---|---|---|
| Green Roofs | High | High, especially in dense areas | Reduces heat absorption, improves insulation, reduces runoff | Costly to implement, may require specialized installation |
| Urban Greening (Parks, Trees) | Medium | High, in any context | Provides shade, evapotranspiration, improves air quality | Requires maintenance, space constraints |
| Light-Colored Building Materials | Low | Medium, suitable in various contexts | Reduces heat absorption, easy to implement | Limited impact alone, may not be sufficient |
Final Conclusion
In conclusion, this study of NYC urban heat island effect thermal camera surface temperature demonstrates the significant impact of urban development on local temperatures. Thermal camera measurements provide valuable insights into the spatial and temporal variations of surface temperatures, which in turn are closely linked to environmental factors. Understanding these patterns allows for the development of mitigation strategies to reduce the urban heat island effect and improve urban sustainability and well-being.
The findings highlight the importance of incorporating thermal camera data into urban planning and design to create more livable and resilient cities.